News Analysis
White Paper
Why Enterprise AI Fails at Scale

Anthropic has released its third Economic Index report, providing one of the most detailed snapshots yet of how artificial intelligence — specifically its Claude model — is being adopted across states, countries, industries and businesses.
The findings suggest AI is becoming more prevalent and increasingly trusted to carry out complex work with little human oversight.
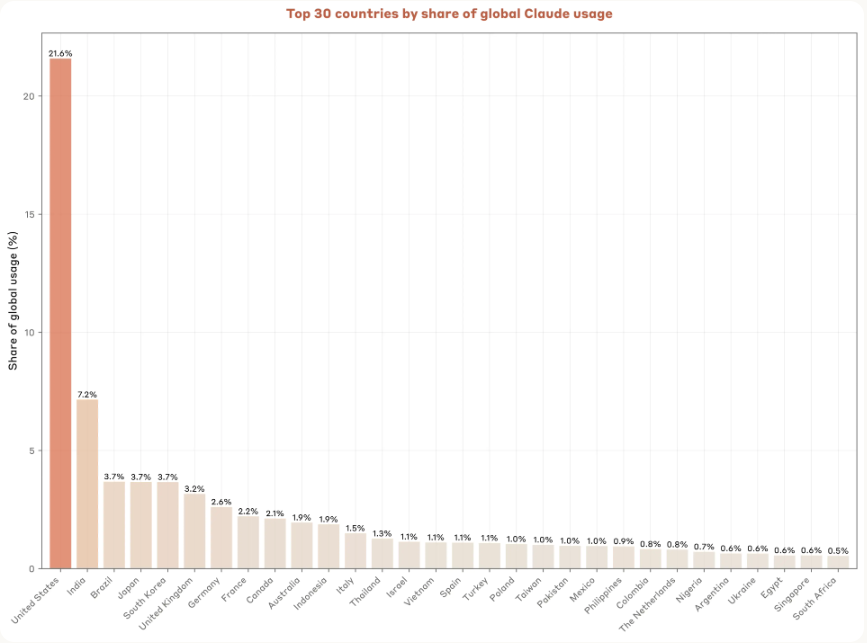
The report shows that AI adoption is remarkably uneven, both globally and within the United States. At the international level, the US remains the dominant user of Claude, accounting for more than 21% of global usage. India, Brazil, Japan and South Korea round out the top five.
But raw usage numbers don’t tell the full story. Anthropic created the Anthropic AI Usage Index (AUI) to measure adoption relative to the working-age population. By that metric, smaller, high-income nations like Israel, Singapore, Australia, New Zealand and South Korea lead the way. The data reveals a strong correlation between GDP per capita and AI adoption: for every 1% increase in GDP per capita, AUI rises by 0.7%.
That link raises an important concern. Historically, transformative technologies like electrification and the combustion engine widened global inequality, with richer countries accelerating ahead. AI could follow a similar path if its benefits concentrate in wealthier economies with robust internet infrastructure and knowledge-based industries.
Related Article: When AI Learns to Hack: Inside CMU and Anthropic’s Cybersecurity Experiment
The same income-based correlation appears when comparing US states — but the picture is more complicated. A 1% increase in per capita GDP is linked with a 1.8% increase in Claude use, but income alone doesn’t explain everything.
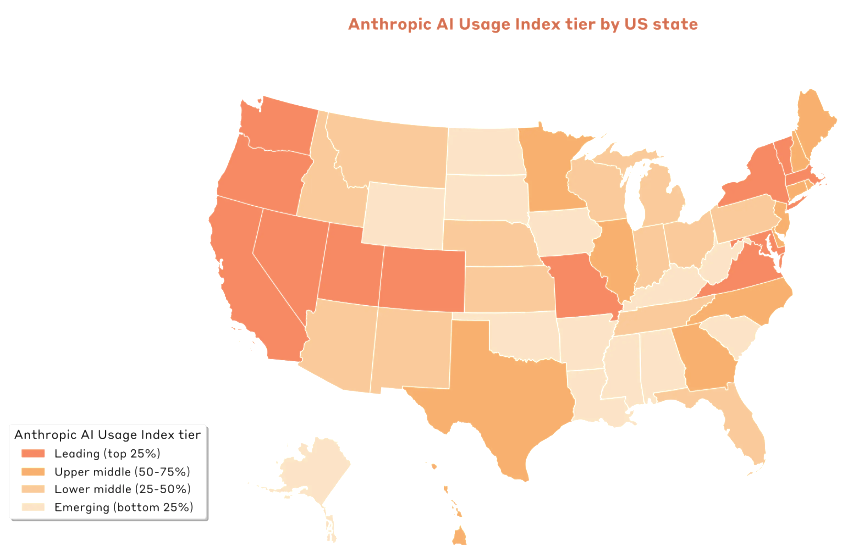
Instead, local industry composition plays a defining role. For example:
AI is embedding itself not just broadly, but specifically within the economic DNA of each region.
Perhaps the most striking shift revealed in the report is the growing reliance on automation. Anthropic tracks how people use Claude by categorizing interactions into augmentation (collaborative tasks) and automation (AI completing work with little oversight).
Back in December 2024, directive automation accounted for 27% of usage. By mid-2025, that number had jumped to 39%, tipping the overall balance in favor of automation (49.1%) over augmentation (47%).
The change suggests growing trust in AI’s capabilities. As models like Claude improve at anticipating user needs and generating high-quality outputs, more people are willing to accept results on the first attempt rather than iterate collaboratively.
Still, the global pattern is nuanced. In countries with higher per-capita use, people lean toward augmentation, while lower-use countries rely more heavily on automation. That may reflect cultural differences, the maturity of adoption or resource constraints that encourage fully outsourcing tasks to AI.
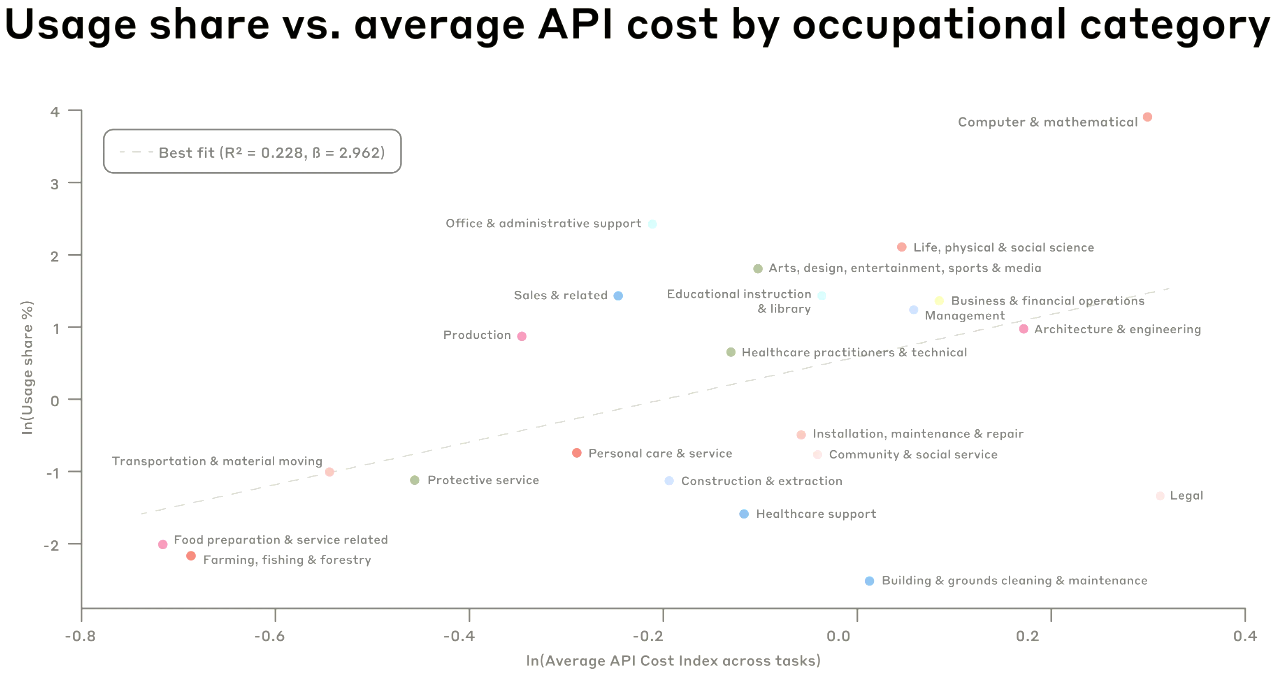
The types of work people delegate to Claude are also shifting. While software engineering remains the dominant use worldwide, other sectors are catching up fast. Since December 2024:
As adoption spreads into knowledge-intensive fields, Claude is being asked to do more diverse work, moving beyond coding into education, research and content-heavy domains.
Related Article: Inside Anthropic’s $1.5B Generative AI Copyright Lawsuit Settlement
For the first time, Anthropic included anonymized data from its API customers — businesses and developers that integrate Claude directly into their systems. Their usage patterns look very different from individual consumers.
If these patterns hold, the economic implications could be significant. Heavy reliance on AI automation within enterprises suggests the potential for major productivity gains, and possible labor market disruption, as companies entrust more responsibility to machines.
Anthropic’s Economic Index is still in its early stages, but it offers one of the clearest windows yet into how AI is weaving itself into daily life and work.
On one hand, organizations and workers who embrace AI may benefit from efficiency and competitive advantages. On the other, the concentration of adoption in wealthy economies and industries could deepen economic divides, both globally and domestically.
What’s clear is that people are becoming increasingly comfortable letting AI do the work. Whether editing research papers in Massachusetts, planning travel in Hawaii or coding applications in India, Claude is steadily becoming a co-worker, and in many cases, an autonomous one.
As Anthropic put it, “The nature of people’s use of Claude is evidently still being defined: we’re still collectively deciding how much confidence we have in AI tools, and how much responsibility we should give them.”
While software engineering remains the most common task globally, other areas are growing rapidly:
Michelle Hawley is an experienced journalist who specializes in reporting on the impact of technology on society. As editorial director at Simpler Media Group, she oversees the day-to-day operations of VKTR, covering the world of enterprise AI and managing a network of contributing writers. She's also the host of CMSWire's CMO Circle and co-host of CMSWire's CX Decoded. With an MFA in creative writing and background in both news and marketing, she offers unique insights on the topics of tech disruption, corporate responsibility, changing AI legislation and more. She currently resides in Pennsylvania with her husband and two dogs. Connect with Michelle Hawley: 
